


Earlier this week, I forwarded a client some historical data on Saskatoon commercial real estate capitalization rates. He came back to me with the comment, “Would be interesting how it (cap rate information) trends with interest rates.”
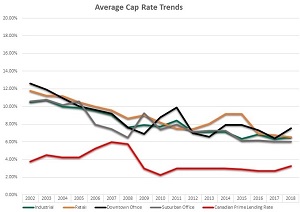
GRAPHIC: Cap rates vs. interest rates comparison. Click for a full-size version of the graphic. (Graphic courtesy ICR Commercial)
Sophisticated investors absorb data to make informed investment decisions. I asked our market analyst to gather the information. Here are my observations because of that research.
There is correlation between the two, but it is not always as close as one would think: view this graph going back to 2002.
Because commercial mortgage rates can vary significantly over such items as property sector, loan to value and borrower covenant, we’ve chosen to illustrate the Canadian Chartered Bank prime lending rate in this graph.
A somewhat surprising result?
You can see between 2009 and 2018 there has been relatively little movement in the prime rate but large fluctuations in cap rates.
One might think the correlation would be greater!
You might be thinking: I’ll bet if we graphed the vacancy rate in each sector, we’d see a greater correlation.
You’d be somewhat right. However, the trend between capitalization and vacancy rates seem to run together for a period of time, then suddenly veer off in opposite directions.
Vacancy rates in each sector can vary quite dramatically at any given time (currently retail is 3.2 per cent, industrial is 6.9 and office is 17.7 per cent).
Other factors affecting cap rates
The two other main factors which affect cap rates are investment product supply and demand, as well as investor confidence (which is obviously tied to overall regional economic conditions).
The fact is that each of these economic elements play a part in the cycles illustrated in the graph.
When in recent history have we seen the greatest spread?
In an earlier post, I referenced “cash-on-cash” return. The benefits of this calculation can increase exponentially as the spread between cap and interest rates become wider.
Take a look at the spread in 2002. The prime lending rate was 3.75 per cent while the cap rate between the four sectors illustrated averaged 11.5 per cent.
Those were the days when we saw cash-on-cash rates of over 30 per cent. Will we ever see a return to that kind of market spread?
I would run from the advisor who states he can answer that question.
Valuable life lesson learned
In 1981, mortgage rates were at 22 per cent. I was betting it wise to lock in for five years because economists were predicting it would rise to 28 per cent.
It did not; 22 per cent was a short-time high. I learned a valuable life lesson at that point in time.
We are in increasingly complex times. Economists for the most part have proven the inability to accurately forecast the long game.
Early in 2019 we will be publishing semi-annual investment reports which will dig deeper into this topic.
We invite your input. Let us know what specific commercial real estate analysis would be beneficial to support your investment decisions.
