

In 2008, it took two months from the crash for countries to begin printing money. In 2020, it took just two weeks. We heard “inflation is not a problem”, then we heard “it is transitory” and yet . . . here we are today.
Predicting market cycles is nearly impossible. But history rhymes and cycles follow typical patterns. Our industry has many veterans who lived through such cycles and recognize these patterns.
I am not one of the veterans. But, I look for answers in history.
In my first Predicting market cycles article I asked, “If central banks increase rates to control inflation, what will it do to the economy?”
My question came from models developed by renowned investors like Ray Dalio and Howard Marks. Now that we are living this reality, it seems fitting to write a second chapter.
Not all recessions are created equal
From post-Second World War until the 1970s, we saw classic industrial inventory cycle recessions. The U.S. had a manufacturing economy, and when there was excess inventory and a change in demand, there was a sharp and short-lived recession.
Blue-collar workers would suffer layoffs, followed by a rebound in employment.
But in the 1970s and 1980s, recessions were fundamentally different – caused by U.S. federal government fiscal policy. The U.S. became dependent on imported commodities and the economy was vulnerable to supply shock.
Funding the Vietnam War (among other things) led to budget deficits and that led to inflation. The 1970s became a decade of “stagflation”. This is because of the Bretton Woods System (the end of gold standard and creation of a fixed international currency exchange) and the dependence on international oil prices.
A sluggish economy with inflationary pressure was new to the U.S. President Jimmy Carter appointed Paul Volcker to deal with it as the new Federal Reserve Board chairman.
Instead of focusing on the Fed’s two mandates – inflation and employment targets – Volcker focused on money supply growth. This led to sharp interest rate increases, spurred unemployment and helped lead to the 1980-’82 recession.
Volcker’s fiscal policies however, ultimately led to the end of skyrocketing inflation.
Does this sound familiar?
That is because central banks are following a playbook that once worked! Despite two recessions in the early 1980s because of high interest rates, Volcker is credited with keeping inflation under control.
Continuing to look back, as recessions became financial – based on market bubbles – we saw:
– 1990-’91 Commercial Real Estate (CRE) or “Credit-Crunch” ;
– 2001 Dot-com Bubble;
– 2007-’09 Housing Market Crash, Global Financial Crisis (GFC).
The problem with financial recessions is that they last longer. The de-leveraging must occur and it takes time.
Aggregate demand drops and liquidity is lower. This kind of recession tends to hit the service sector of the economy more strongly.
Inflationary forces: 2008 vs. 2020
“Inflation is always and everywhere a monetary phenomenon.” – Milton Friedman, 1963
Inflation didn’t happen after the 2008 GFC. Some economists thought that central bank balance sheets can swell without causing inflation, but they were wrong.
A few reasons:
– Central banks and governments used every imaginable lever to stimulate the economy during the pandemic – monetary and fiscal policies.
– As a result, the banks received new money and held on to the new money. Excess reserves doubled in the U.S. between February and May 2020.
– To encourage more lending, the Federal Reserve eliminated reserve requirements.
This put post-2008 measures to shame; 2020 stimulus was enormous in comparison. Worse yet, this time we also have inflation from supply-chain logjams and commodity shortages. Other things to blame are extreme weather, the war in Ukraine, geopolitics and de-globalization.
Inflation today is the key focus not only for capital markets but for households, businesses, politicians and media.
Central bankers walk a fine line of rate hikes vs. sparking a recession.
Everyone is thinking about the inflation-driven recessions of the mid-1970s and early 1980s. And about Paul Volcker’s playbook.
What does this mean for real estate?
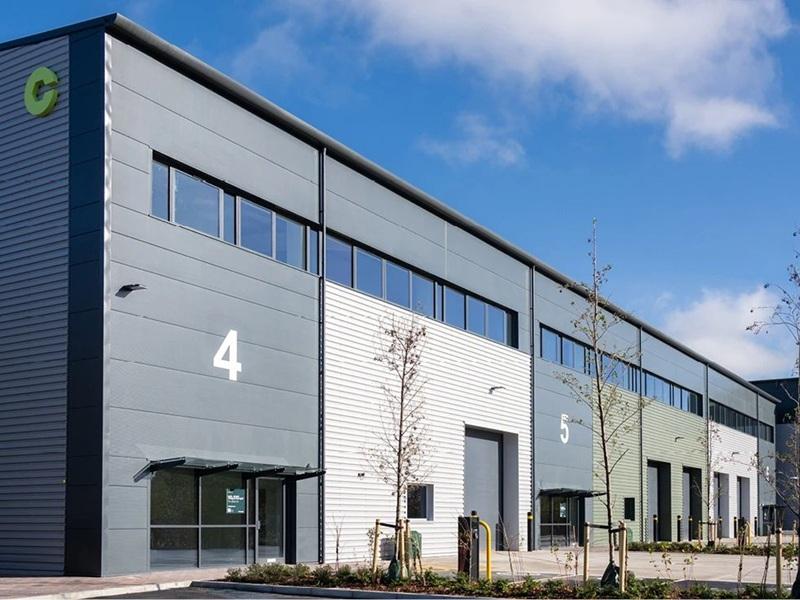
The housing sector is a consumption good, part of final demand. But commercial real estate (CRE) adds to production on the supply side of the economy.
CRE is also considered a capital asset. Much like stocks and bonds, CRE is often found on the balance sheets of institutional investors and banks.
This means CRE helps add to employment and GDP. It is vital to economic recovery.
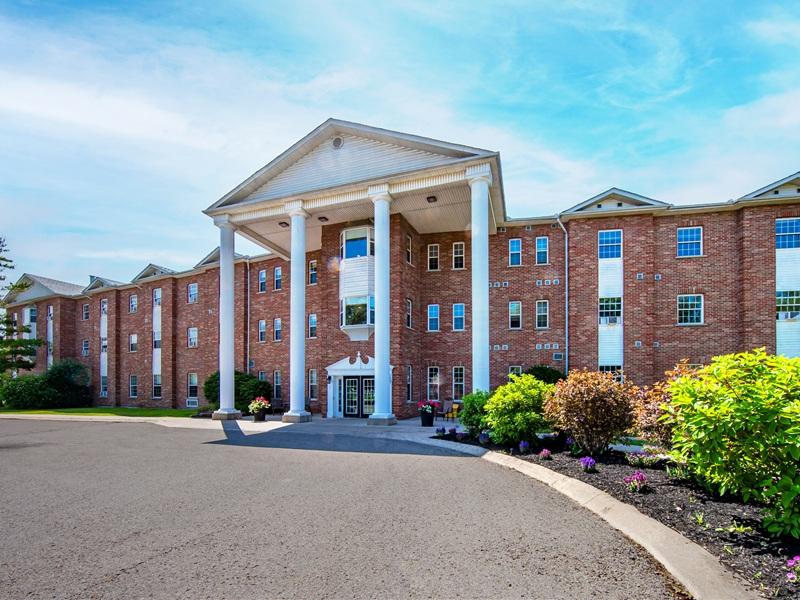
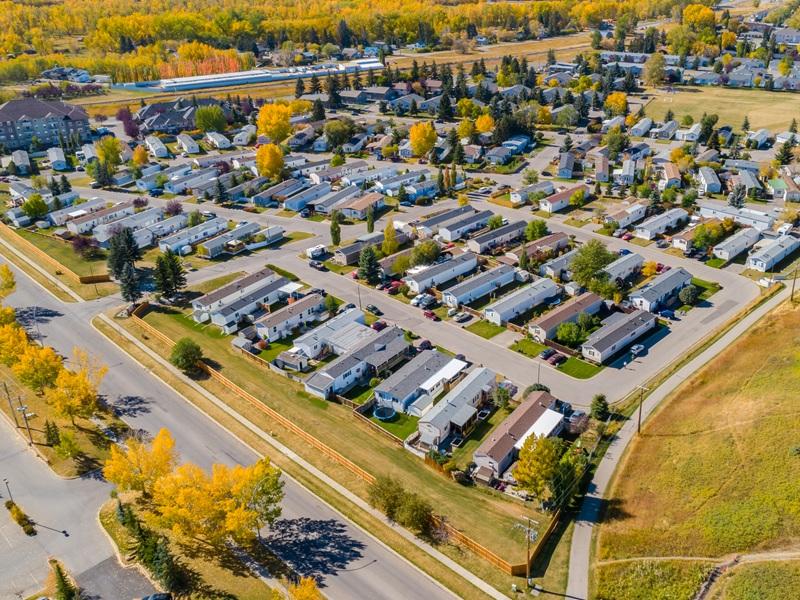
The housing sector responds faster to rate hikes. Canadian home prices declined for the second straight month – an abrupt turnaround in our housing market.
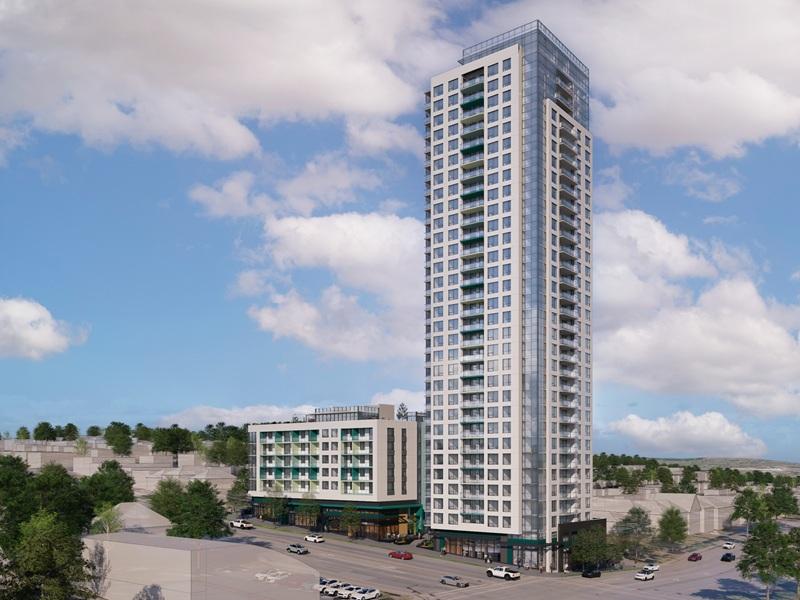
Many multifamily housing projects are being put on hold and this will impact the construction cycle. Yet people need housing and countries like Canada are in great demand for immigration.
How about the impact on CRE?
CRE has a smaller share of the market than housing, representing perhaps 1/3 and housing 2/3.
CRE also tends to be less directly related to the general macro-economic business cycle. Analysis of it is more complicated.
What will happen to CRE cap rates and prices?
What is the cap rate? In CRE it is the rate of return expected to be generated on an investment property. Cap rate = Net Operating Income (NOI) / Current Market Value (Purchase Price).
If NOI is $100,000 and it is purchased for $1 million, then the cap rate is 10 per cent.
When interest rates are low, cap rates are also low. With low interest rates, servicing larger debt requires less income – i.e. is “cheaper”. More cheap credit = more cash to buy. Due to demand, prices for CRE increase and cap rates decrease.
How are cap rates influenced by inflation? Cap rates follow real interest rates. Real interest rate = nominal interest minus inflation. E.g. nominal rate 5% – inflation 6% = real interest rate is -1%.
High inflation = cap rates decrease and property prices increase.
If real interest rates are lower, why do we see the CRE market expecting higher cap rates?
– CRE has long-term leases and fixed NOI. Real ROI drops with higher cost of servicing debt and fixed NOI.
– Buyers’ expectations of more nominal interest rate hikes and taming of inflation.
Values of CRE are not immediately reflected because they are typically based on income. And commercial leases are typically long-term.
As long as inflation is higher than nominal interest rates, expect real property value to go up. But there is a delay because lease rates are not immediately adjusted.
Putting it all together
We are facing inflation; central banks are raising rates, and everyone is worried about a recession.
Benjamin Tal says “60 to 65 per cent of the inflation we are seeing now – not all of it, but a big part of it – is COVID-related. If you all agree with that assumption that this is a transition year, that should disappear over the next year.”
I truly hope he’s right. But I am concerned that what many consider transitory tends to last longer.
China’s “Zero Covid” policy isn’t working – we have mass testing and restrictions. Goods are delayed in production and delivery.
The war in Ukraine isn’t ending and it’s causing food and energy problems around the world.
De-globalization means more warehouse space is needed to make and store goods during off-season to satisfy demand later (making goods more expensive).
Yet we have record low industrial vacancy; land and construction costs are driving warehousing prices ever higher.
The question is, if rate hikes cause unemployment and a recession – will central banks abandon fighting inflation to stimulate the economy?

